
TatvaAI Forecasts Explained
Updated 8/31/20262 min read
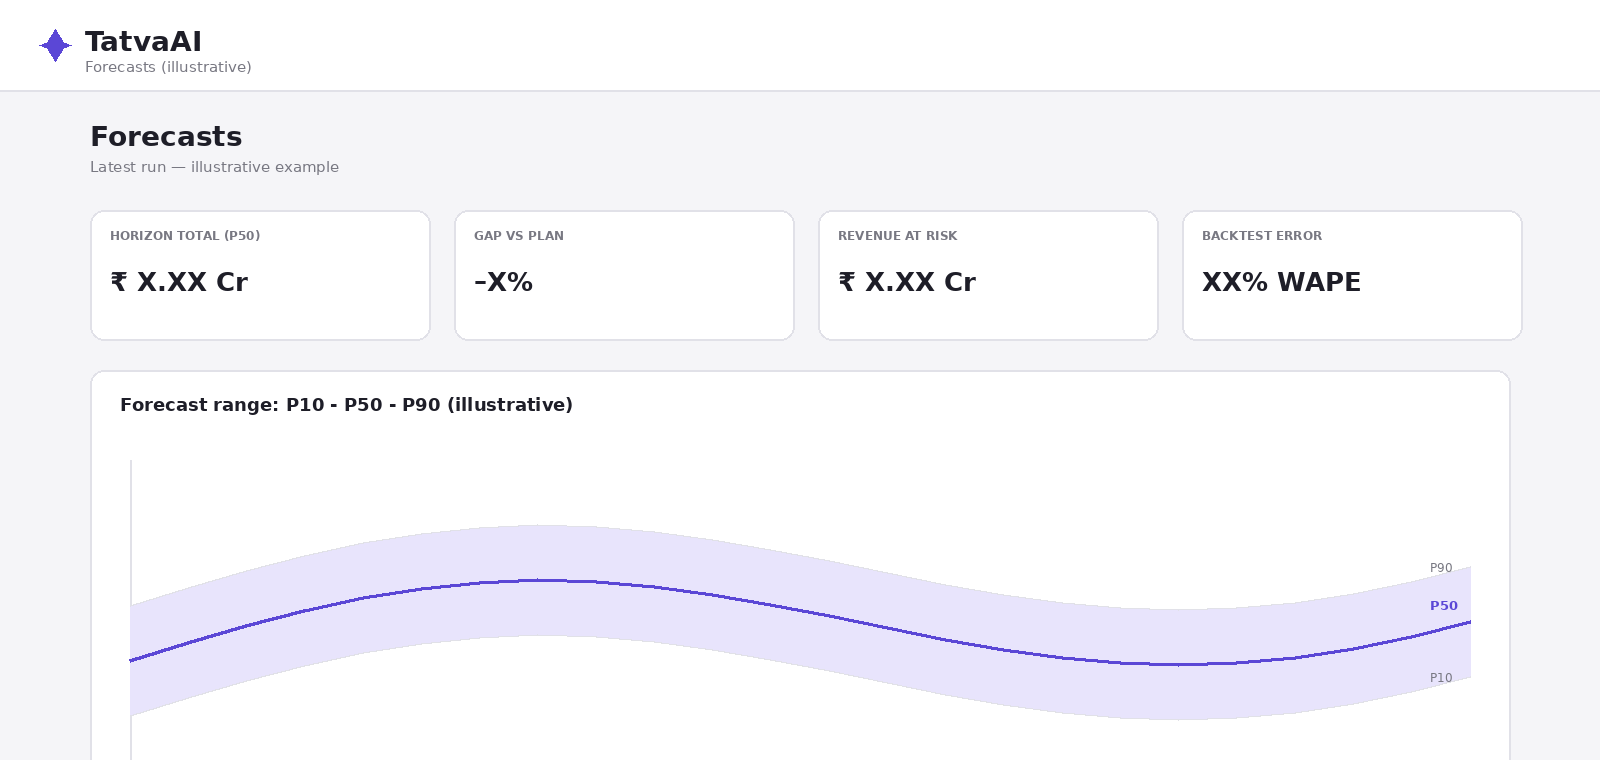
Forecasts are never a single guaranteed number — they're a range of possibilities. TatvaAI communicates this honestly by showing forecasts as a range, using the statistical terms P10, P50, and P90. This article explains what these mean and how to read them.
What P10, P50, and P90 Represent
- P50 — the median forecast; the single most likely outcome, with an equal chance of the actual result landing above or below it
- P10 — a conservative, lower-bound scenario; there's only a 10% chance the actual result falls below this
- P90 — an optimistic, upper-bound scenario; there's a 90% chance the actual result falls below this
Together, P10 to P90 defines a realistic range within which the actual outcome is likely to fall, rather than pretending a single number can capture the future precisely.
Why a Range Is More Useful Than a Single Number
A single-point forecast hides uncertainty. If a business plans entirely around a P50 number and the outcome comes in near P10, budgets and commitments can be thrown off. Seeing the full range upfront helps businesses plan with appropriate caution — for example, setting minimum commitments based on P10 rather than P50.
Where This Shows Up in TatvaAI
A TatvaAI forecast typically shows the "Horizon Total (P50)" as the headline number, alongside the P10 and P90 boundaries, giving a full picture of the forecast's spread rather than false precision.
What "Gap vs Plan" Means
Alongside the statistical forecast, TatvaAI can show a "Gap vs Plan" figure, comparing the forecast against a previously loaded business plan or budget — highlighting whether the current trajectory is tracking ahead of, or behind, what was originally planned.
Practical Use Case
A finance leader preparing a board update uses the P50 as the headline expected number, but also mentions the P10-P90 range to set realistic expectations about volatility, rather than presenting a single number as if it were guaranteed.
FAQ
Q1: What does P50 mean?
The median, most likely forecast outcome.
Q2: What does P10 represent?
A conservative lower-bound scenario.
Q3: What does P90 represent?
An optimistic upper-bound scenario.
Q4: Why not just look at P50?
Because it hides the uncertainty around the actual outcome.
Q5: What does "Gap vs Plan" show?
How the forecast compares to a previously loaded business plan or budget.
Related content
Is this article helpful?
Help us improve our articles.