
TatvaAI Control Center
Updated 8/31/20262 min read
Most businesses monitor risk in separate silos — sales watches customers, procurement watches vendors, warehouse teams watch inventory, and finance watches cash. TatvaAI's Control Center brings all of that into a single screen, answering one question: "what is good, watch, risk, and critical across the business — and what should I do about it?"
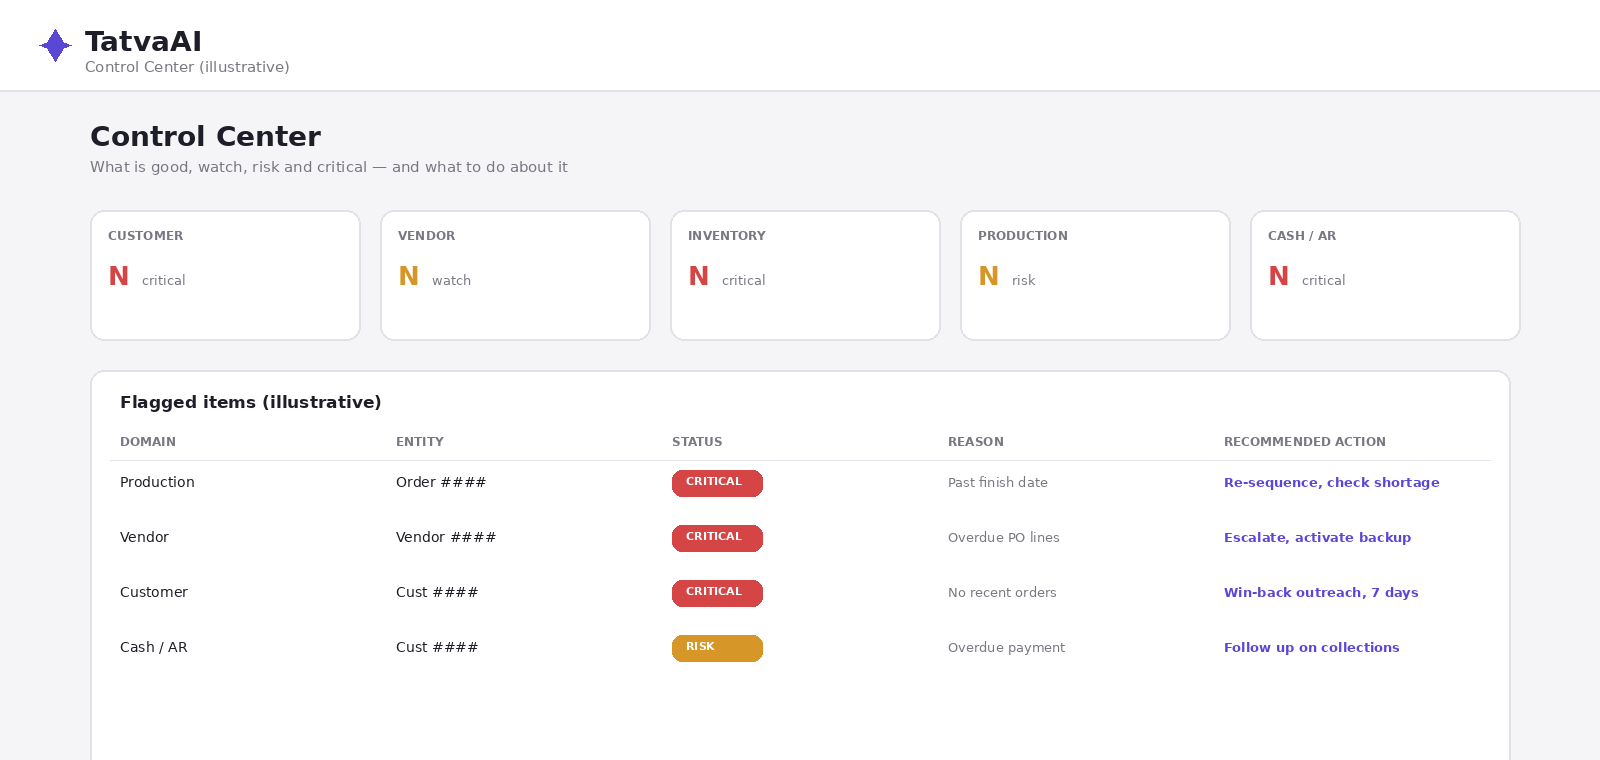
The Structure of the Control Center
The Control Center is organized into domain summary tiles, each showing a count of entities in different states:
- Customer — customers flagged as critical, at risk, or worth watching
- Vendor — vendors flagged similarly, often tied to overdue purchase orders
- Inventory — materials or stock items flagged for shortage or excess
- Production — production orders flagged for delays or quality issues
- Cash / AR — receivables and cash items flagged for risk
Below the tiles, a detailed table lists each flagged entity with its domain, status, the underlying metric, the reason it was flagged, and a recommended action.
What "Critical," "Risk," and "Watch" Mean
These labels represent a severity scale:
- Critical — needs immediate attention; the underlying issue is already significant
- Risk — trending toward a problem if not addressed
- Watch — worth monitoring, but not yet urgent
- Good — no current concern
This structure lets a business leader triage quickly — critical items first, then risk, then watch — rather than treating every flagged item as equally urgent.
Why a Unified View Matters
Without a unified Control Center, spotting a connection between, say, a vendor's overdue deliveries and a production delay requires manually cross-referencing two separate reports. The Control Center surfaces these connections automatically, since all domains are visible together.
Who Uses the Control Center
This view is particularly useful for leadership and operations managers who need a daily pulse on the business without digging through individual departmental reports.
FAQ
Q1: What does the Control Center show?
A unified view of what's good, watch, risk, and critical across the business.
Q2: What domains does it cover?
Customer, Vendor, Inventory, Production, and Cash/AR.
Q3: What does "critical" mean?
An issue that needs immediate attention.
Q4: How is this different from a single dashboard?
It combines multiple domains into one risk-focused view, with recommended actions.
Q5: Who typically uses the Control Center?
Leadership and operations managers needing a daily business pulse.
Related content
Is this article helpful?
Help us improve our articles.