
Building and Customizing Dashboards in TatvaAI
Updated 8/31/20262 min read
Every business tracks slightly different numbers. TatvaAI dashboards are built to be customized, so teams can arrange the KPI cards and charts that matter most to them, rather than being stuck with a fixed, generic layout.
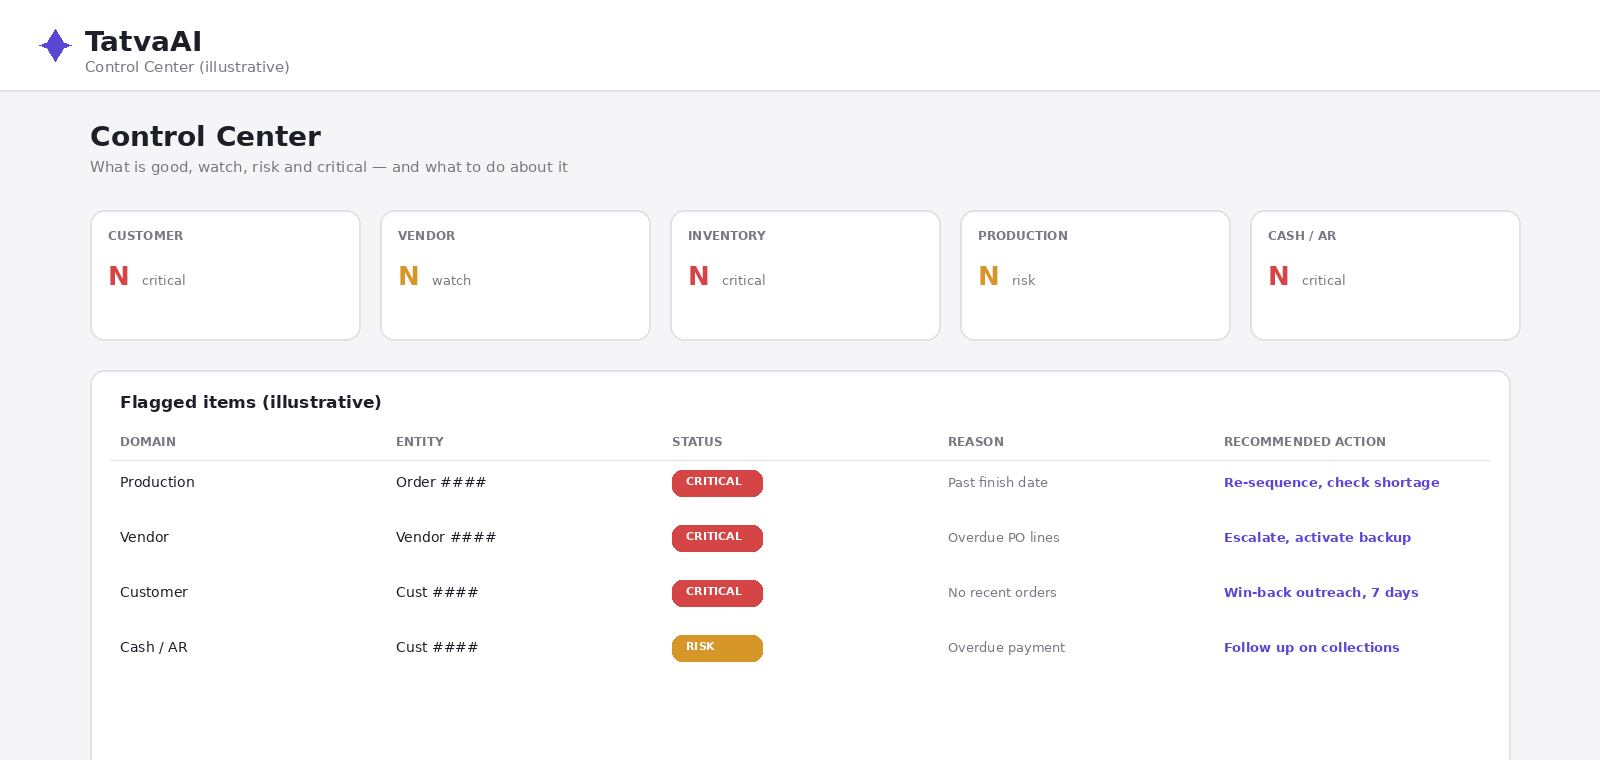
Adding and Arranging Charts
Within a dashboard, individual chart cards can be added, edited, or removed. Cards can typically be resized and repositioned within the layout, so the most important metrics can be given more visual prominence.
Choosing the Right Chart Type
Different metrics call for different visual formats:
- A single running total (like total stock value) works best as a KPI card
- A metric changing over time (like spend trend) works best as a line or trend chart
- A metric best understood in list form (like top vendors) works best as a data table
Picking the right format for each metric makes a dashboard easier to scan at a glance.
Setting Cache Duration
Because dashboards can contain several charts pulling from live ERP data, a cache duration (in seconds) can typically be set per dashboard, balancing freshness against performance. Frequently changing metrics may need a shorter cache, while stable metrics can use a longer one.
Saving and Sharing Dashboards
Once a dashboard is arranged the way a team wants it, it can be saved so the layout persists for future visits. Well-organized dashboards can then become the default "home view" for a team, replacing manual reporting routines.
Practical Tips for a Useful Dashboard
- Keep each dashboard focused on one business domain rather than mixing everything together
- Put the 3–4 most important KPI cards at the top
- Use trend charts for anything a manager needs to explain "why" behind, not just "what"
- Revisit and prune dashboards periodically as business priorities shift
FAQ
Q 1. Can I customize what's on a dashboard?
Yes, charts can typically be added, removed, and rearranged.
Q 2. How do I choose between a KPI card and a trend chart?
Use a KPI card for a single total, a trend chart for change over time.
Q 3. What does cache duration control?
How often a dashboard's data refreshes from the live source.
Q 4. Can a dashboard layout be saved?
Yes, once arranged, it can be saved for future visits.
Q 5. Should one dashboard cover multiple domains?
It's usually clearer to keep each dashboard focused on one domain.
Related content
Is this article helpful?
Help us improve our articles.