
Reading the Ecosystem Progress Dashboard
Updated 8/18/20262 min read
The Ecosystem Progress section, found at the bottom of your main dashboard, is designed to answer one question clearly: how is your entire training ecosystem performing, right now?
Breaking down the widget:
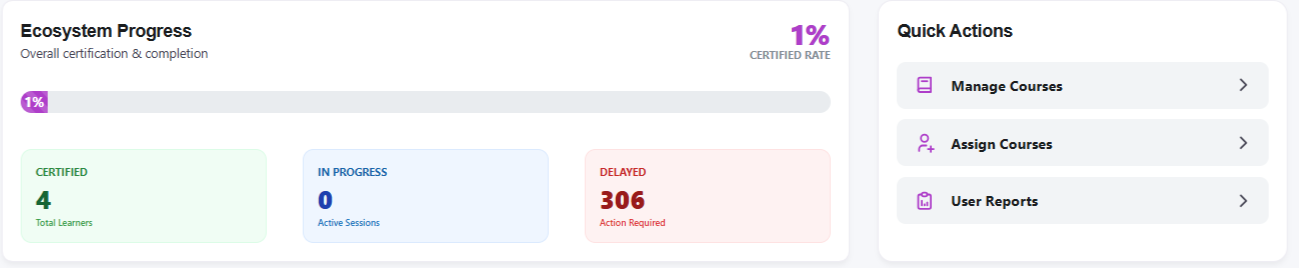
- Certified Rate — displayed prominently as a percentage at the top of the section, this is your headline metric summarizing overall certification success across the platform
- Certified — the total count of learners who have successfully completed certification
- In Progress — learners actively working through assigned content, neither finished nor stalled
- Delayed — learners who are behind schedule and flagged as requiring action, mirroring the Progression Risks widget higher up on the dashboard
Why this widget sits at the bottom of the dashboard: While the top of the dashboard focuses on real-time, actionable alerts (like progression risks), the Ecosystem Progress widget is more of a summary—a "state of the union" view best used for periodic check-ins rather than moment-to-moment monitoring.
How to use this widget effectively:
- Check it weekly or monthly as a health check for your overall training program, rather than daily
- Watch the relationship between the three categories—a healthy ecosystem generally shows a shrinking Delayed count and a growing Certified count over time
- Use a stagnant or declining certified rate as a trigger to dig into more detailed reports (LMS Report, Result Reports) to diagnose the underlying cause
Connecting this widget to action: The Ecosystem Progress dashboard is intentionally high-level — it's meant to tell you that something needs attention, not necessarily why. When the numbers shift in a direction you don't like, your next step should be digging into the more granular reports covered elsewhere in this category — the LMS Report for a broad view, or the User Report for individual-level detail — to understand the root cause.
Used together, the dashboard's real-time alerts and this summary widget give administrators both the immediate, actionable signals and the longer-term trend view needed to keep a training program healthy.
FAQs:
What does the Certified Rate show?
The overall percentage of learners who completed certification.
How often should I check the Ecosystem Progress widget?
Weekly or monthly, as a general health check rather than daily.
Related content
Is this article helpful?
Help us improve our articles.