
Gantt Charts
Updated 8/10/20263 min read
The Gantt Chart view turns your board into a visual timeline, arranging tasks and dates side by side so you can see your entire project schedule at a glance — without leaving your board.
Why use a Gantt chart?
A grid full of dates tells you the facts, but not the shape of your project. A Gantt chart lays every task out along a timeline, so you can immediately see how long each task runs, what overlaps, and where your schedule is tight — all in one screen.
How to add a Gantt view
- Click + Add view — This is next to your existing view tabs (Active, Task Oveview, Work Progress, etc.) at the top of your board.
- Select Gantt — From the Add view panel, choose Gantt from the list of view types (Grid, Gallery, Kanban, Gantt, Calendar, Map View).
- Confirm — Click the + next to Gantt to add it as a new tab on your board.
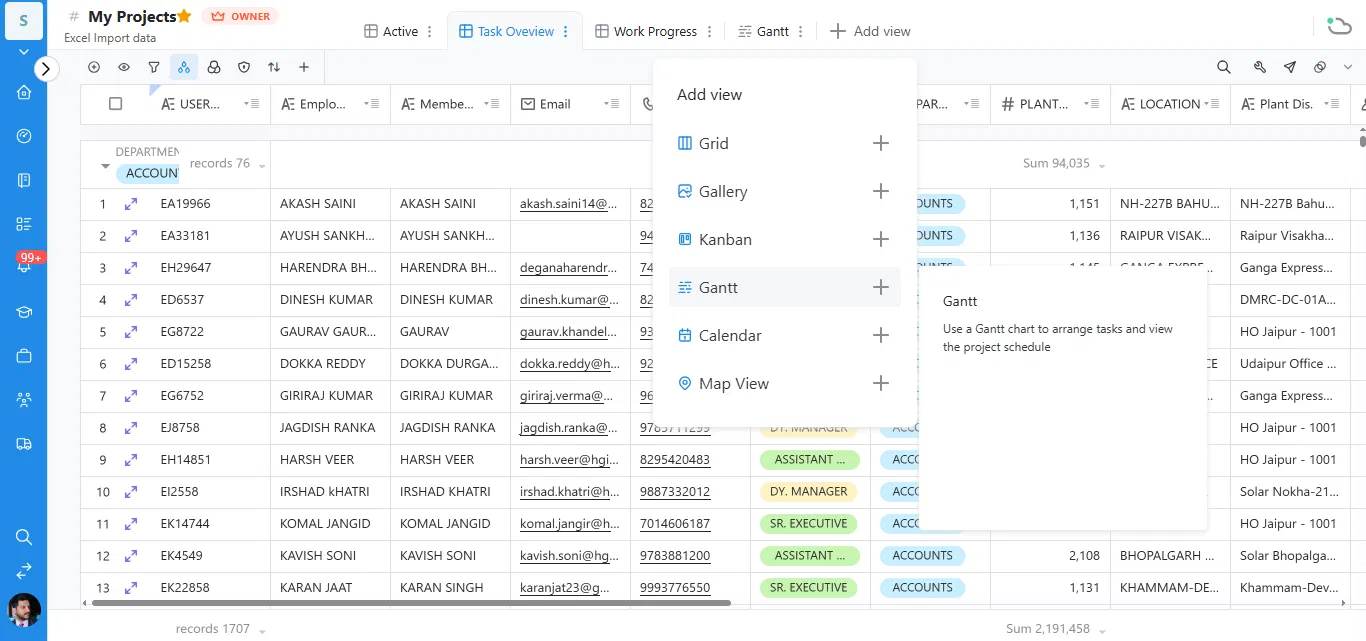
Setting up your timeline
Once the Gantt view is added, open Settings (the gear icon) to configure how your timeline is built:
- Select Date fields — choose which columns represent the Start date and End date for each task. Hoicko needs both to draw the timeline bars.
- Custom task bar color — pick a color for the bars on your chart, or leave it as a custom color per item.
- Custom workdays — choose which days count as working days (e.g. Monday–Friday), so weekends can be excluded from duration calculations.
- Duration only counts — toggle this on if you want task duration calculated using only the selected workdays, rather than all calendar days.
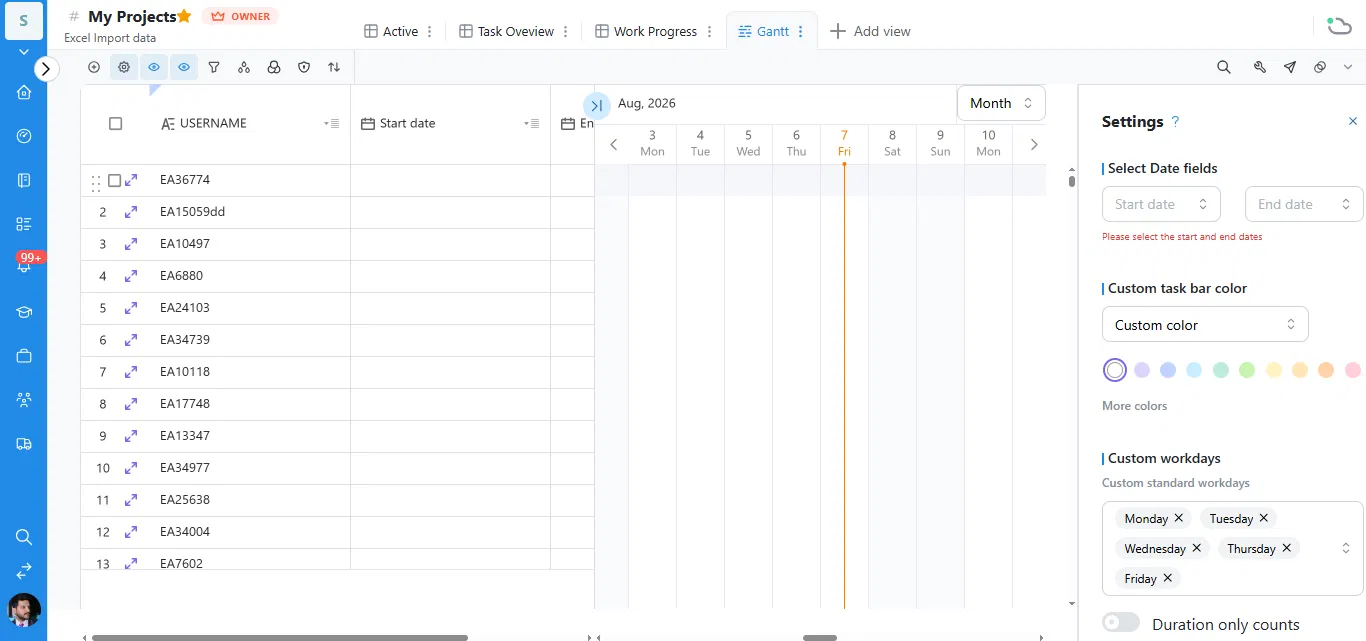
Until Start date and End date are selected, Hoicko will show a reminder — "Please select the start and end dates" — since the chart can't plot a timeline without them.
Navigating the chart
- Switch between Month, Week, or Day zoom using the dropdown in the top right of the timeline.
- Use the arrows next to the date header to move backward or forward in time.
- The vertical highlighted line marks today's date, so you always know where you stand against the schedule.
Tip: Set your Custom workdays to match your team's real work week before relying on task durations — this keeps the calculated timeline accurate instead of counting weekends as working time.
Frequently asked questions
Do I need to set Start and End dates before using the Gantt view?
Yes. The Gantt chart needs both a Start date and an End date column selected in Settings before it can draw task bars on the timeline.
Can I change the task bar color?
Yes. Under Custom task bar color in Settings, you can choose a preset color or pick a custom one from More colors.
Does the Gantt view affect the data on my board?
No. Gantt is just another way of viewing the same board data — editing dates on the timeline updates the same Start date and End date columns used in your Grid view.
Can weekends be excluded from task duration?
Yes. Set your Custom workdays to only the days your team works, and turn on Duration only counts so calculations use working days only.
Is this article helpful?
Help us improve our articles.