
Dashboards
Updated 8/10/20263 min read
A Hoicko dashboard is a single screen that pulls live data from one or more boards and displays it as charts, tables, and numbers, so teams can track leads, tasks, and conversions without opening each board separately.
What is a dashboard in Hoicko?
A dashboard in Hoicko is a customizable reporting screen made up of individual widgets — such as pie charts, bar charts, tables, and number cards. Each widget pulls real data directly from connected boards and updates automatically whenever that data changes. Dashboards do not store separate data; they simply visualize what already exists on your boards.
What can a Hoicko dashboard show?
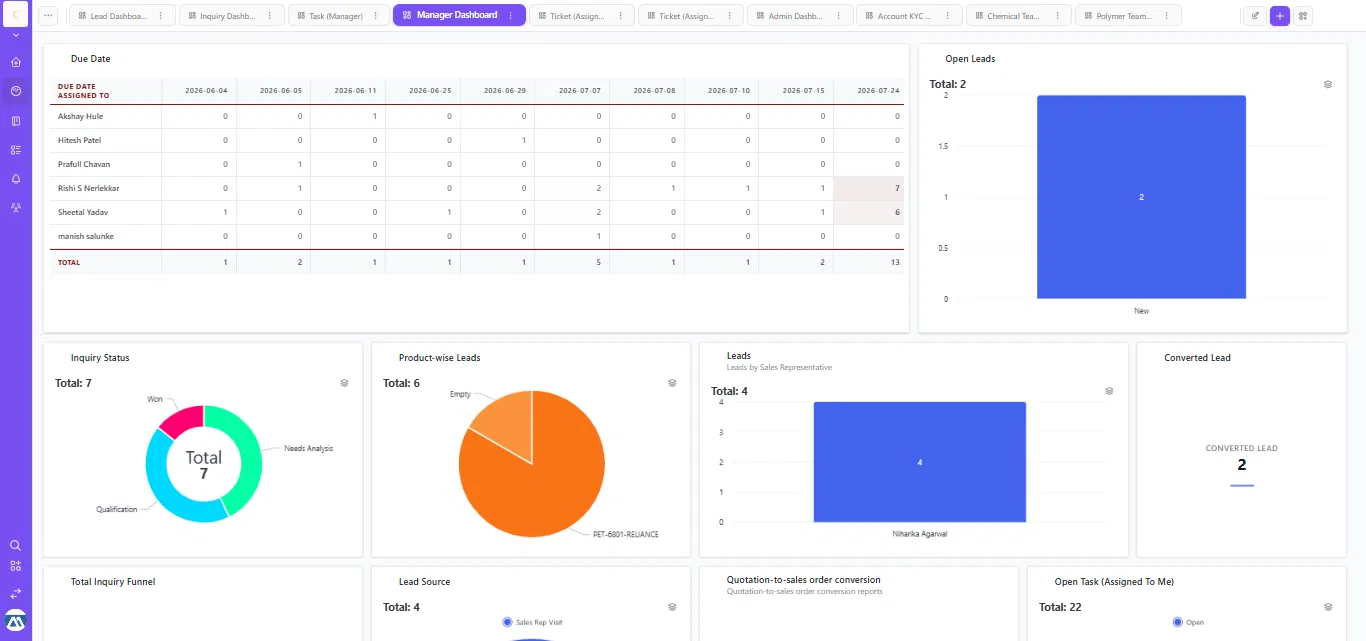
A dashboard can combine multiple types of business data on one screen. Based on a typical manage dashboard in Hoicko, this includes:
- Due Date table — shows how many tasks are due, broken down by team member and date.
- Open Leads — a bar chart totaling active, unconverted leads.
- Inquiry Status — a donut chart showing leads by stage (e.g. Qualification, Needs Analysis, Won).
- Product-wise Leads — a pie chart showing which products are generating the most inquiries.
- Leads by Sales Representative — a bar chart comparing lead volume per salesperson.
- Converted Lead — a number card showing total leads converted to customers.
- Total Inquiry Funnel — a funnel view of leads moving through each sales stage.
- Lead Source — a breakdown of where leads are coming from (e.g. sales rep visits, website, referrals).
- Quotation-to-Sales Order Conversion — a report tracking how many quotations turn into confirmed orders.
- Open Tasks (Assigned to Me) — a live count of tasks currently open and assigned to the logged-in user.
How to create a dashboard in Hoicko
- Open the dashboard tab — Click the + icon next to your existing boards/dashboards at the top, and select New Dashboard.
- Name it — Give the dashboard a clear name, such as "Manager Dashboard" or "Sales Overview," so your team knows its purpose at a glance.
- Connect your boards — Choose which board(s) the dashboard should pull data from. You can connect more than one board to the same dashboard.
- Add widgets — Click + Add Widget and choose a widget type — table, pie chart, bar chart, funnel, or number card — based on what you want to track.
- Configure each widget — Select which columns, groups, or people each widget should report on. Use the gear icon on any widget to adjust its settings later.
- Arrange the layout — Drag and resize widgets so the most important numbers are visible first, without scrolling.
Why use a dashboard instead of checking each board manually?
Checking multiple boards individually is slow and easy to get wrong, especially when a manager needs a same-day view across leads, tasks, and conversions. A dashboard removes that step: it aggregates numbers from every connected board into one screen, updates in real time, and can be shared with people who only need to view results, not edit the underlying board.
Frequently asked questions
Does a Hoicko dashboard update automatically?
Yes. Every widget reflects live data from its connected board(s). There is no manual refresh needed — if an item's status or value changes on the board, the dashboard updates immediately.
Can one dashboard pull data from multiple boards?
Yes. A single dashboard can combine widgets from several different boards, which is what allows a Manager Dashboard to show leads, tasks, and conversion data together in one place.
Can I create more than one dashboard?
Yes. Hoicko allows multiple dashboards — for example, a separate dashboard for Leads, Tasks, Tickets, or Admin reporting, each tailored to a specific team or role.
Can I control who sees a dashboard?
Yes. Dashboards can be shared with specific people as viewers, so they can see the reported data without being able to edit the widgets or the layout.
What widget types are available on a Hoicko dashboard?
Common widget types include tables, pie charts, donut charts, bar charts, funnel charts, and number cards. Widgets are chosen based on the kind of data being reported — totals, trends, breakdowns, or comparisons.
Is this article helpful?
Help us improve our articles.