
Bridging Forecast vs Plan
Updated 8/31/20262 min read
A forecast and a business plan rarely match exactly — and understanding why they diverge is often more valuable than the forecast number itself. TatvaAI's Bridge and Plan views are designed to make that gap visible and explainable.
What "Gap vs Plan" Represents
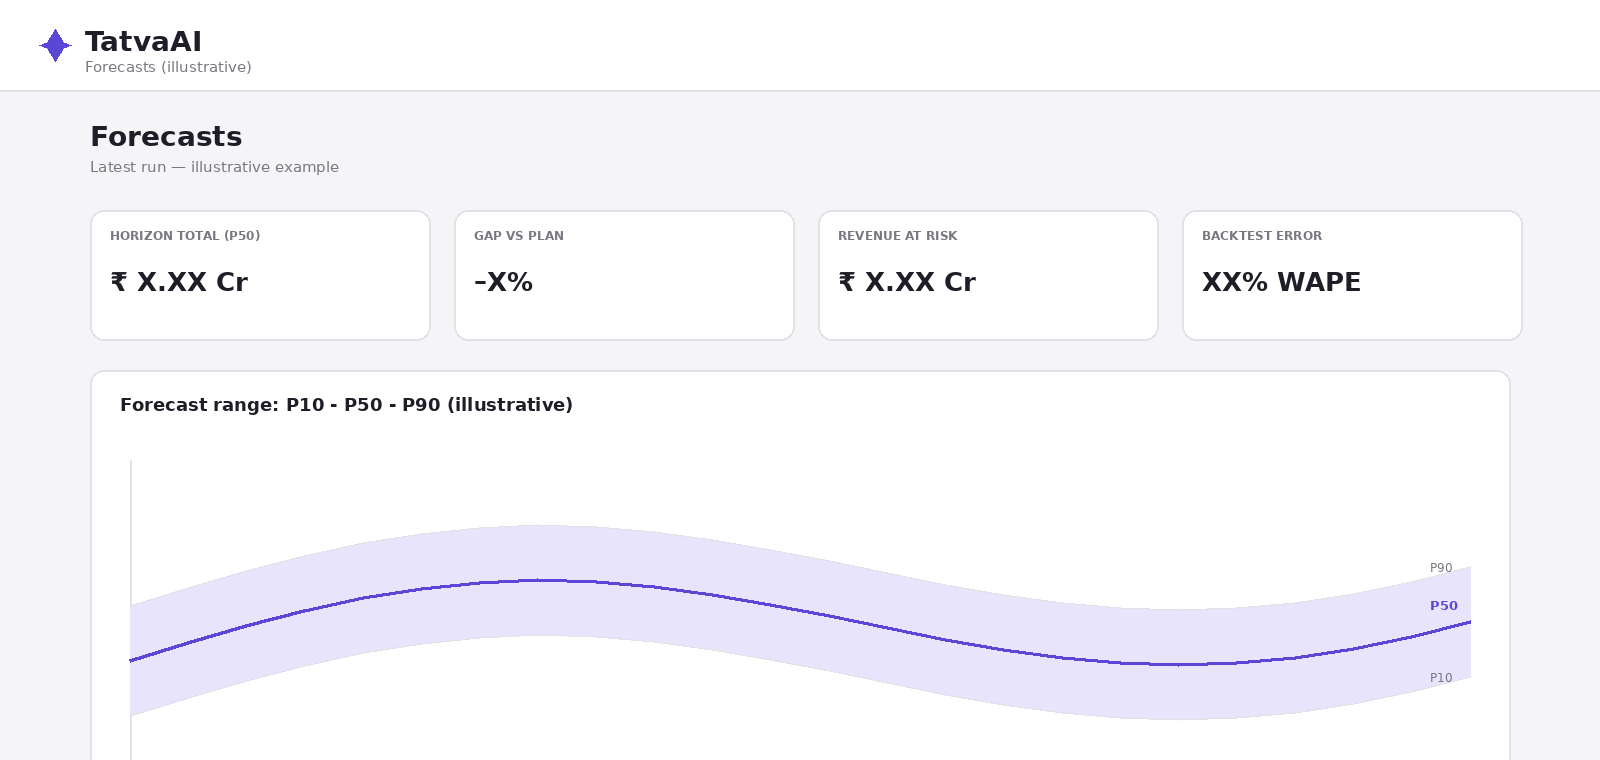
When a business plan or budget has been loaded into TatvaAI, the forecast can be directly compared against it, surfacing a "Gap vs Plan" figure that shows whether the current trajectory is tracking ahead of, or behind, what was originally budgeted.
Why a Bridge View Helps
A single gap number tells you there's a difference, but not why. A Bridge view typically breaks that difference down into contributing factors — such as volume changes, pricing changes, or shifts in specific product lines or regions — so the "why" behind the gap becomes clear, not just the "how much."
Using This for Course Correction
Once the drivers behind a gap are visible, teams can act on the actual cause rather than reacting to the headline number alone. If a gap is driven mostly by one region underperforming, for example, attention and resources can be directed there specifically.
Keeping Forecast and Plan in Sync
Because forecasts are refreshed regularly while plans are typically set less frequently (such as annually or quarterly), the Gap vs Plan view becomes especially valuable partway through a planning period — showing early warning signs well before the plan's original review cycle would have caught them.
Practical Use Case
A regional sales director notices a growing negative gap vs plan for their region. Using the Bridge view, they trace it to a slower ramp on new product lines rather than pricing issues, allowing them to focus corrective action specifically on new-product adoption rather than discounting.
FAQ
Q1: What does "Gap vs Plan" show?
Whether the forecast is tracking ahead of or behind the original business plan.
Q2: What does the Bridge view add beyond the gap number?
A breakdown of the specific factors driving that gap.
Q3: Why is this useful mid-period, not just at year-end?
It provides early warning before the plan's normal review cycle would catch it.
Q4: What kinds of factors might a Bridge view reveal?
Volume, pricing, or shifts across specific product lines or regions.
Q5: Who benefits most from this view?
Regional and finance leaders responsible for hitting plan targets.
Related content
Is this article helpful?
Help us improve our articles.